
Reports
Analytics pulls together how your published posts did and how your follower counts moved.
What’s on the page
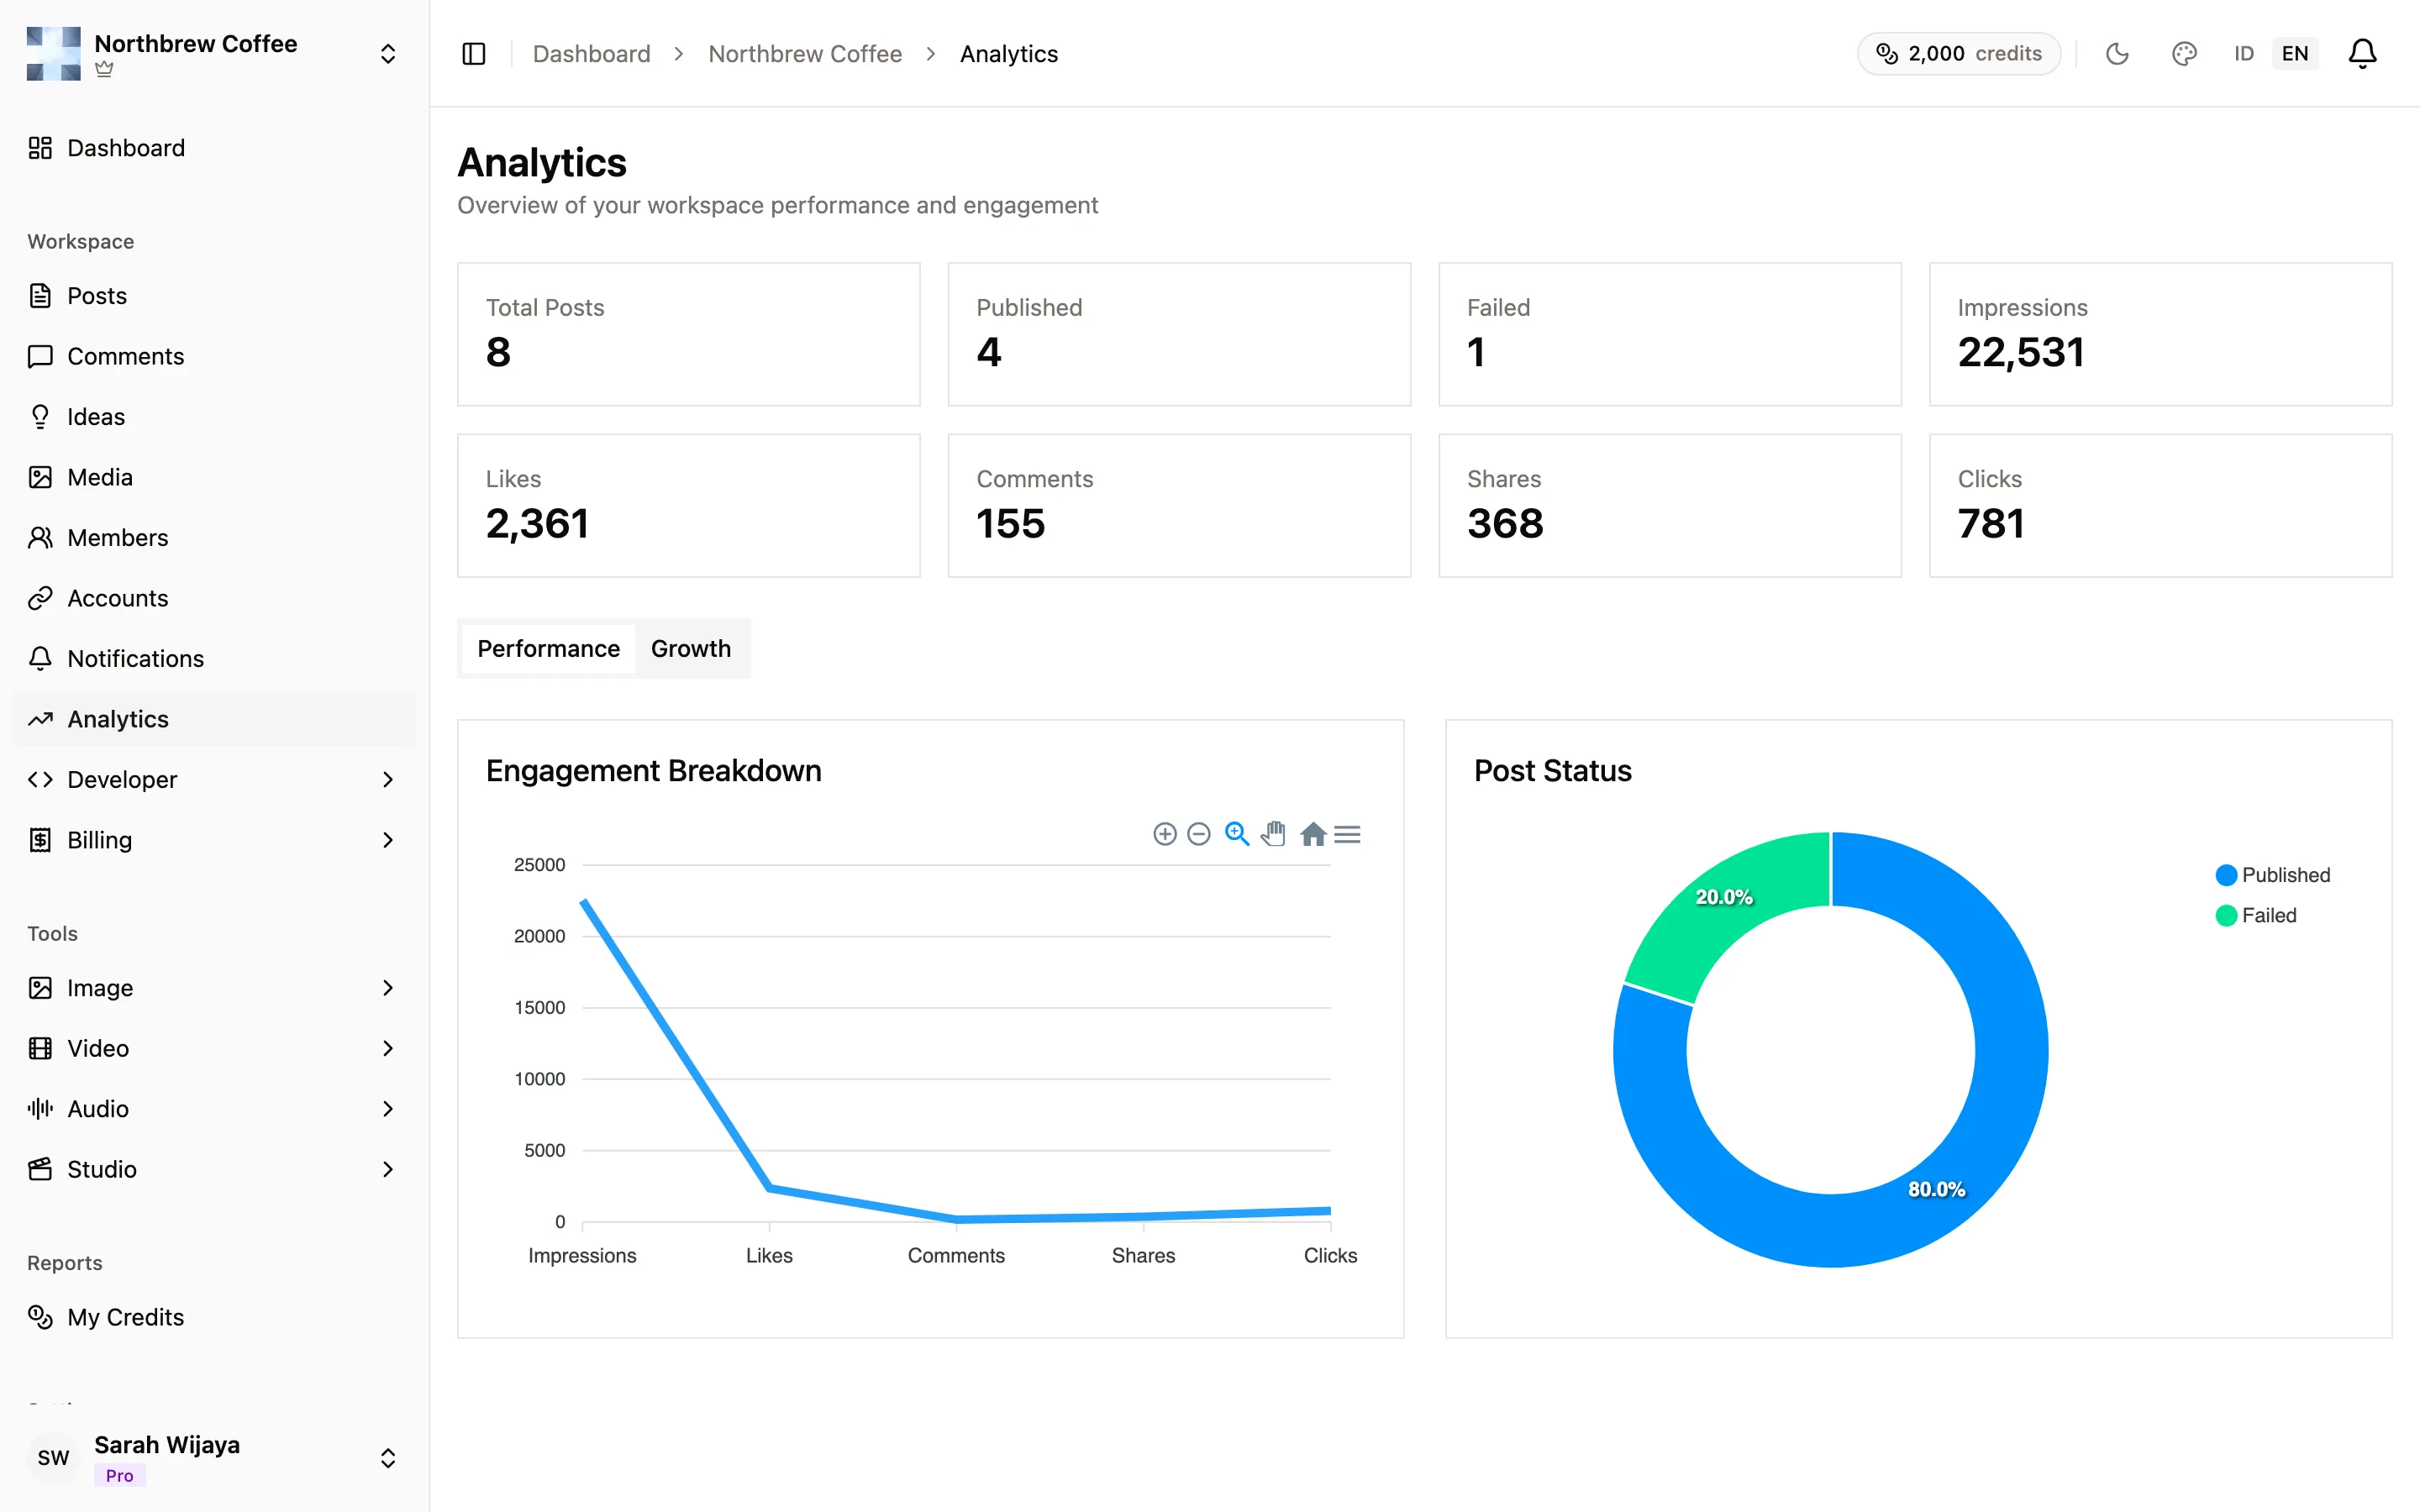
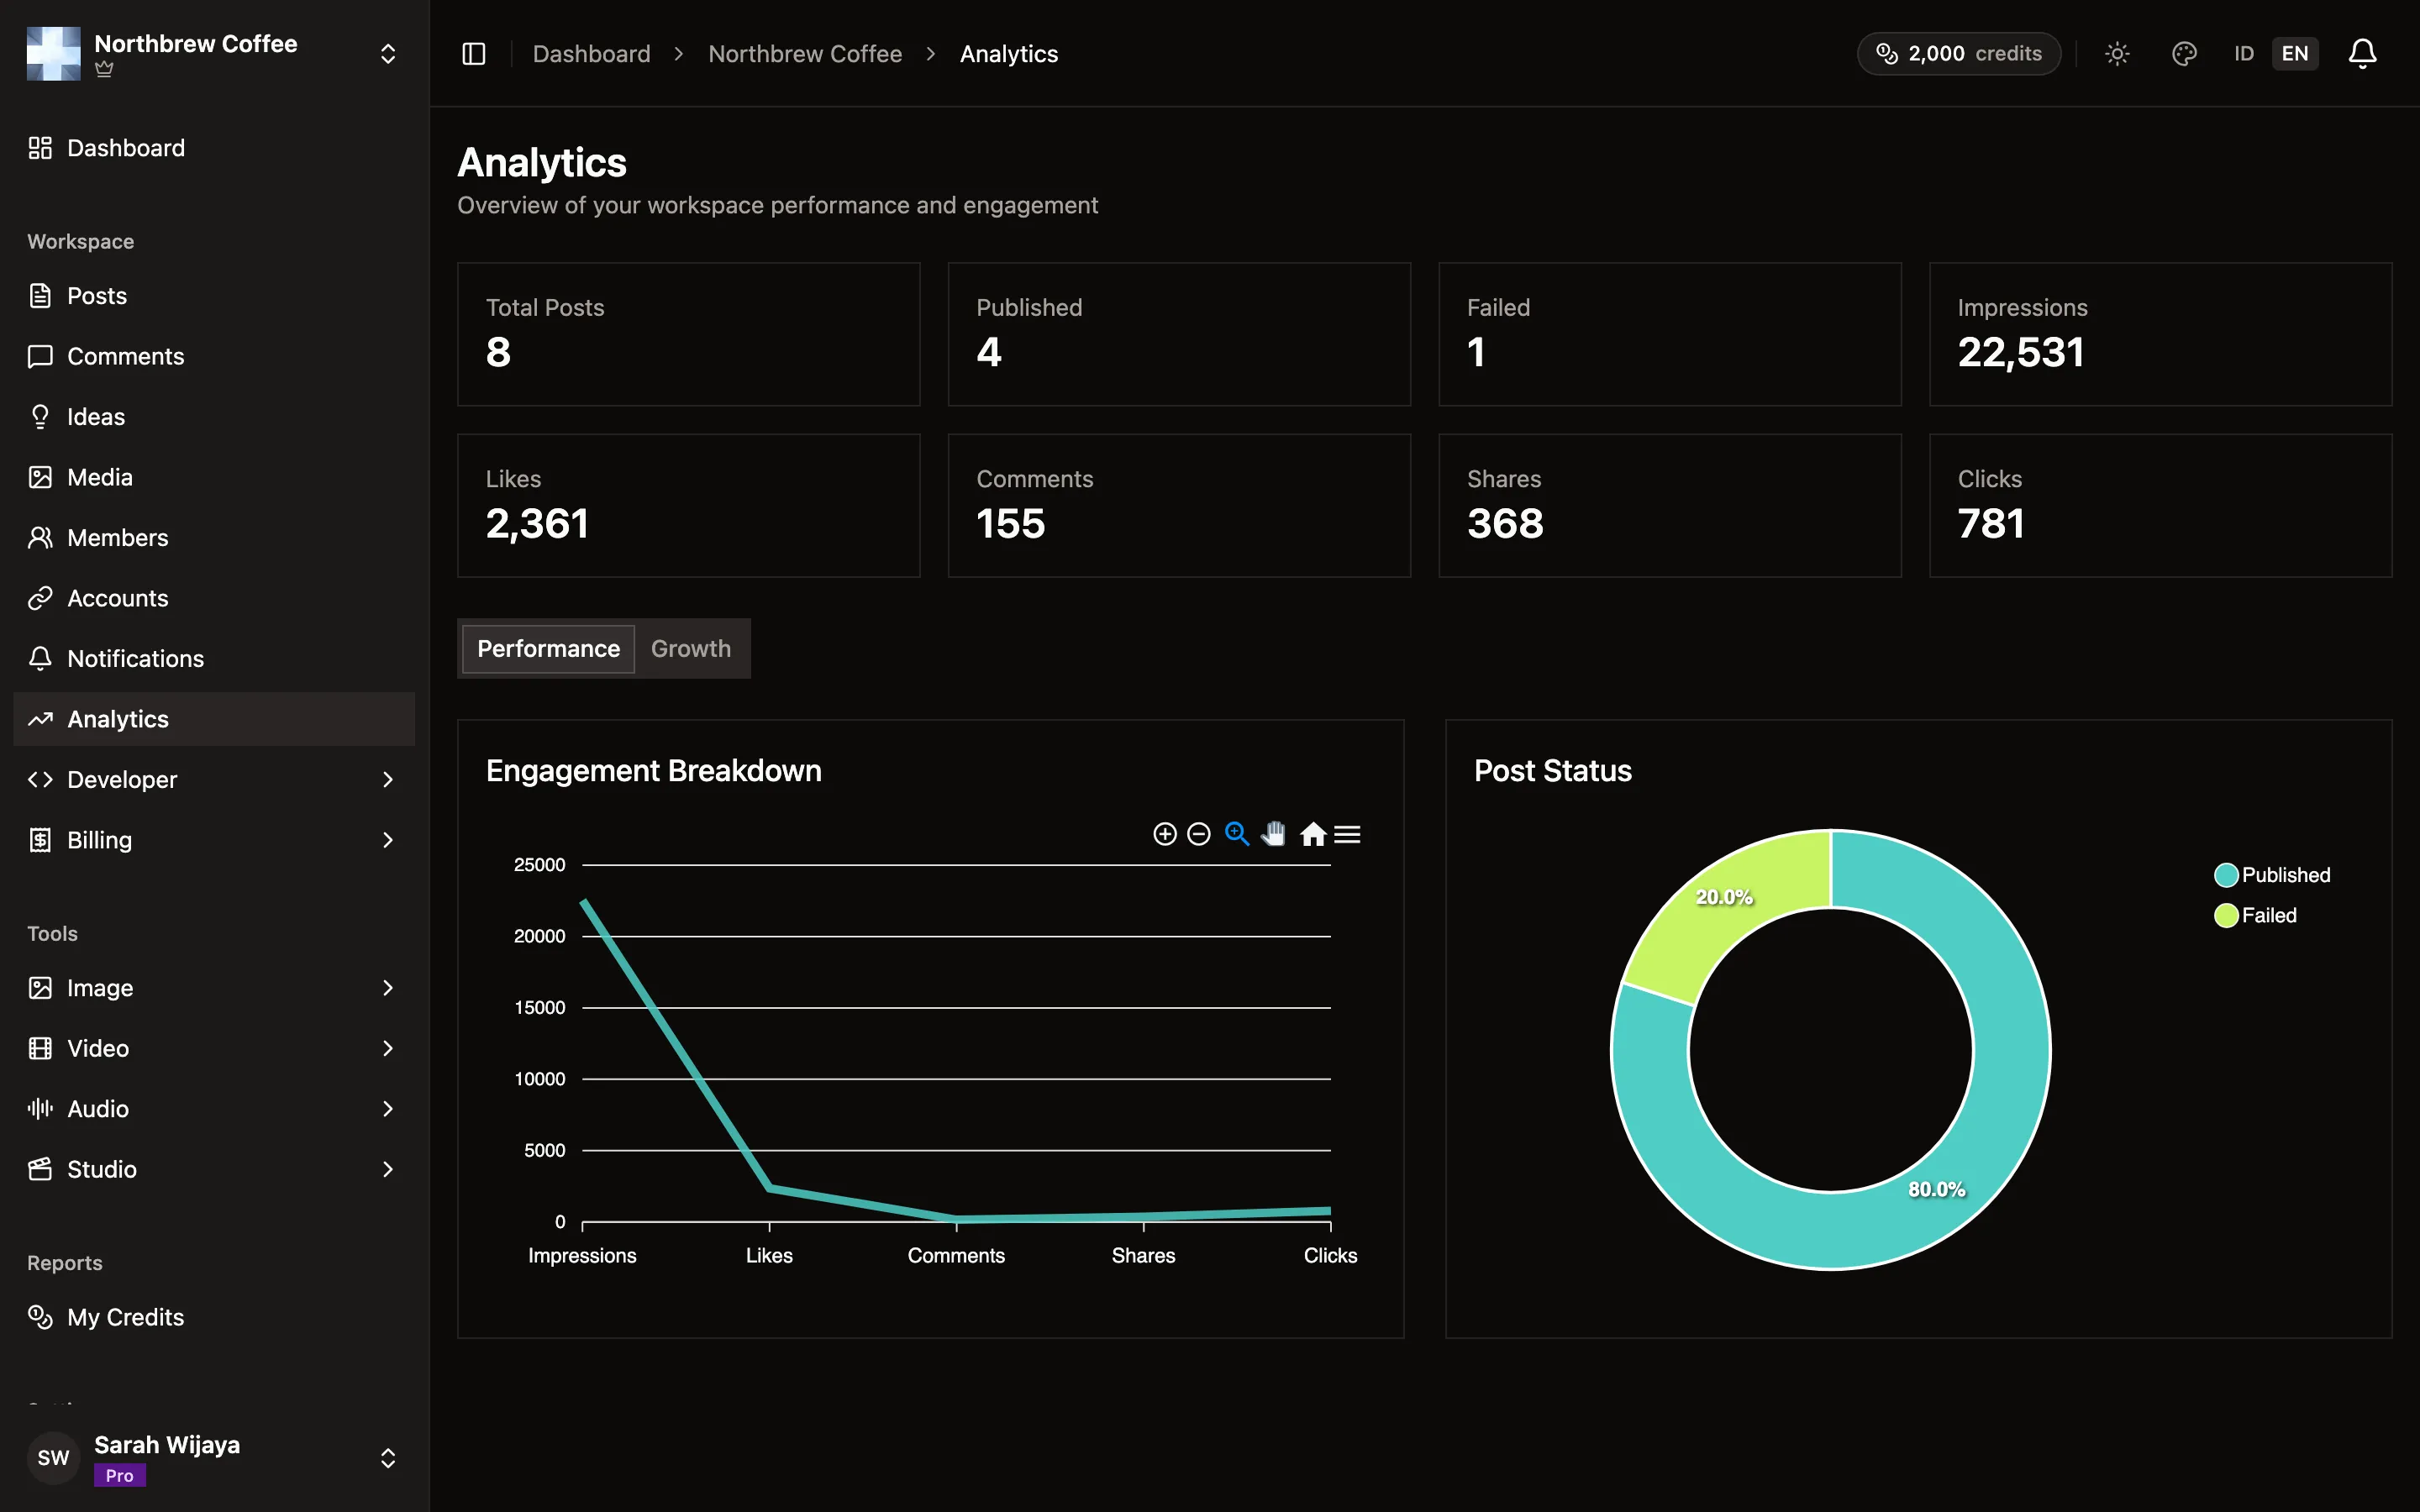
Section titled “What’s on the page”Eight totals across the top: Total Posts, Published, Failed, then Impressions, Likes, Comments, Shares and Clicks.
These are running totals for the whole workspace, not a monthly figure. There is no date filter, no comparison against last month, and no export. It’s a health check, not a reporting tool.
Below that, two tabs:
- Performance — the engagement numbers charted next to each other, and a doughnut showing published against failed posts.
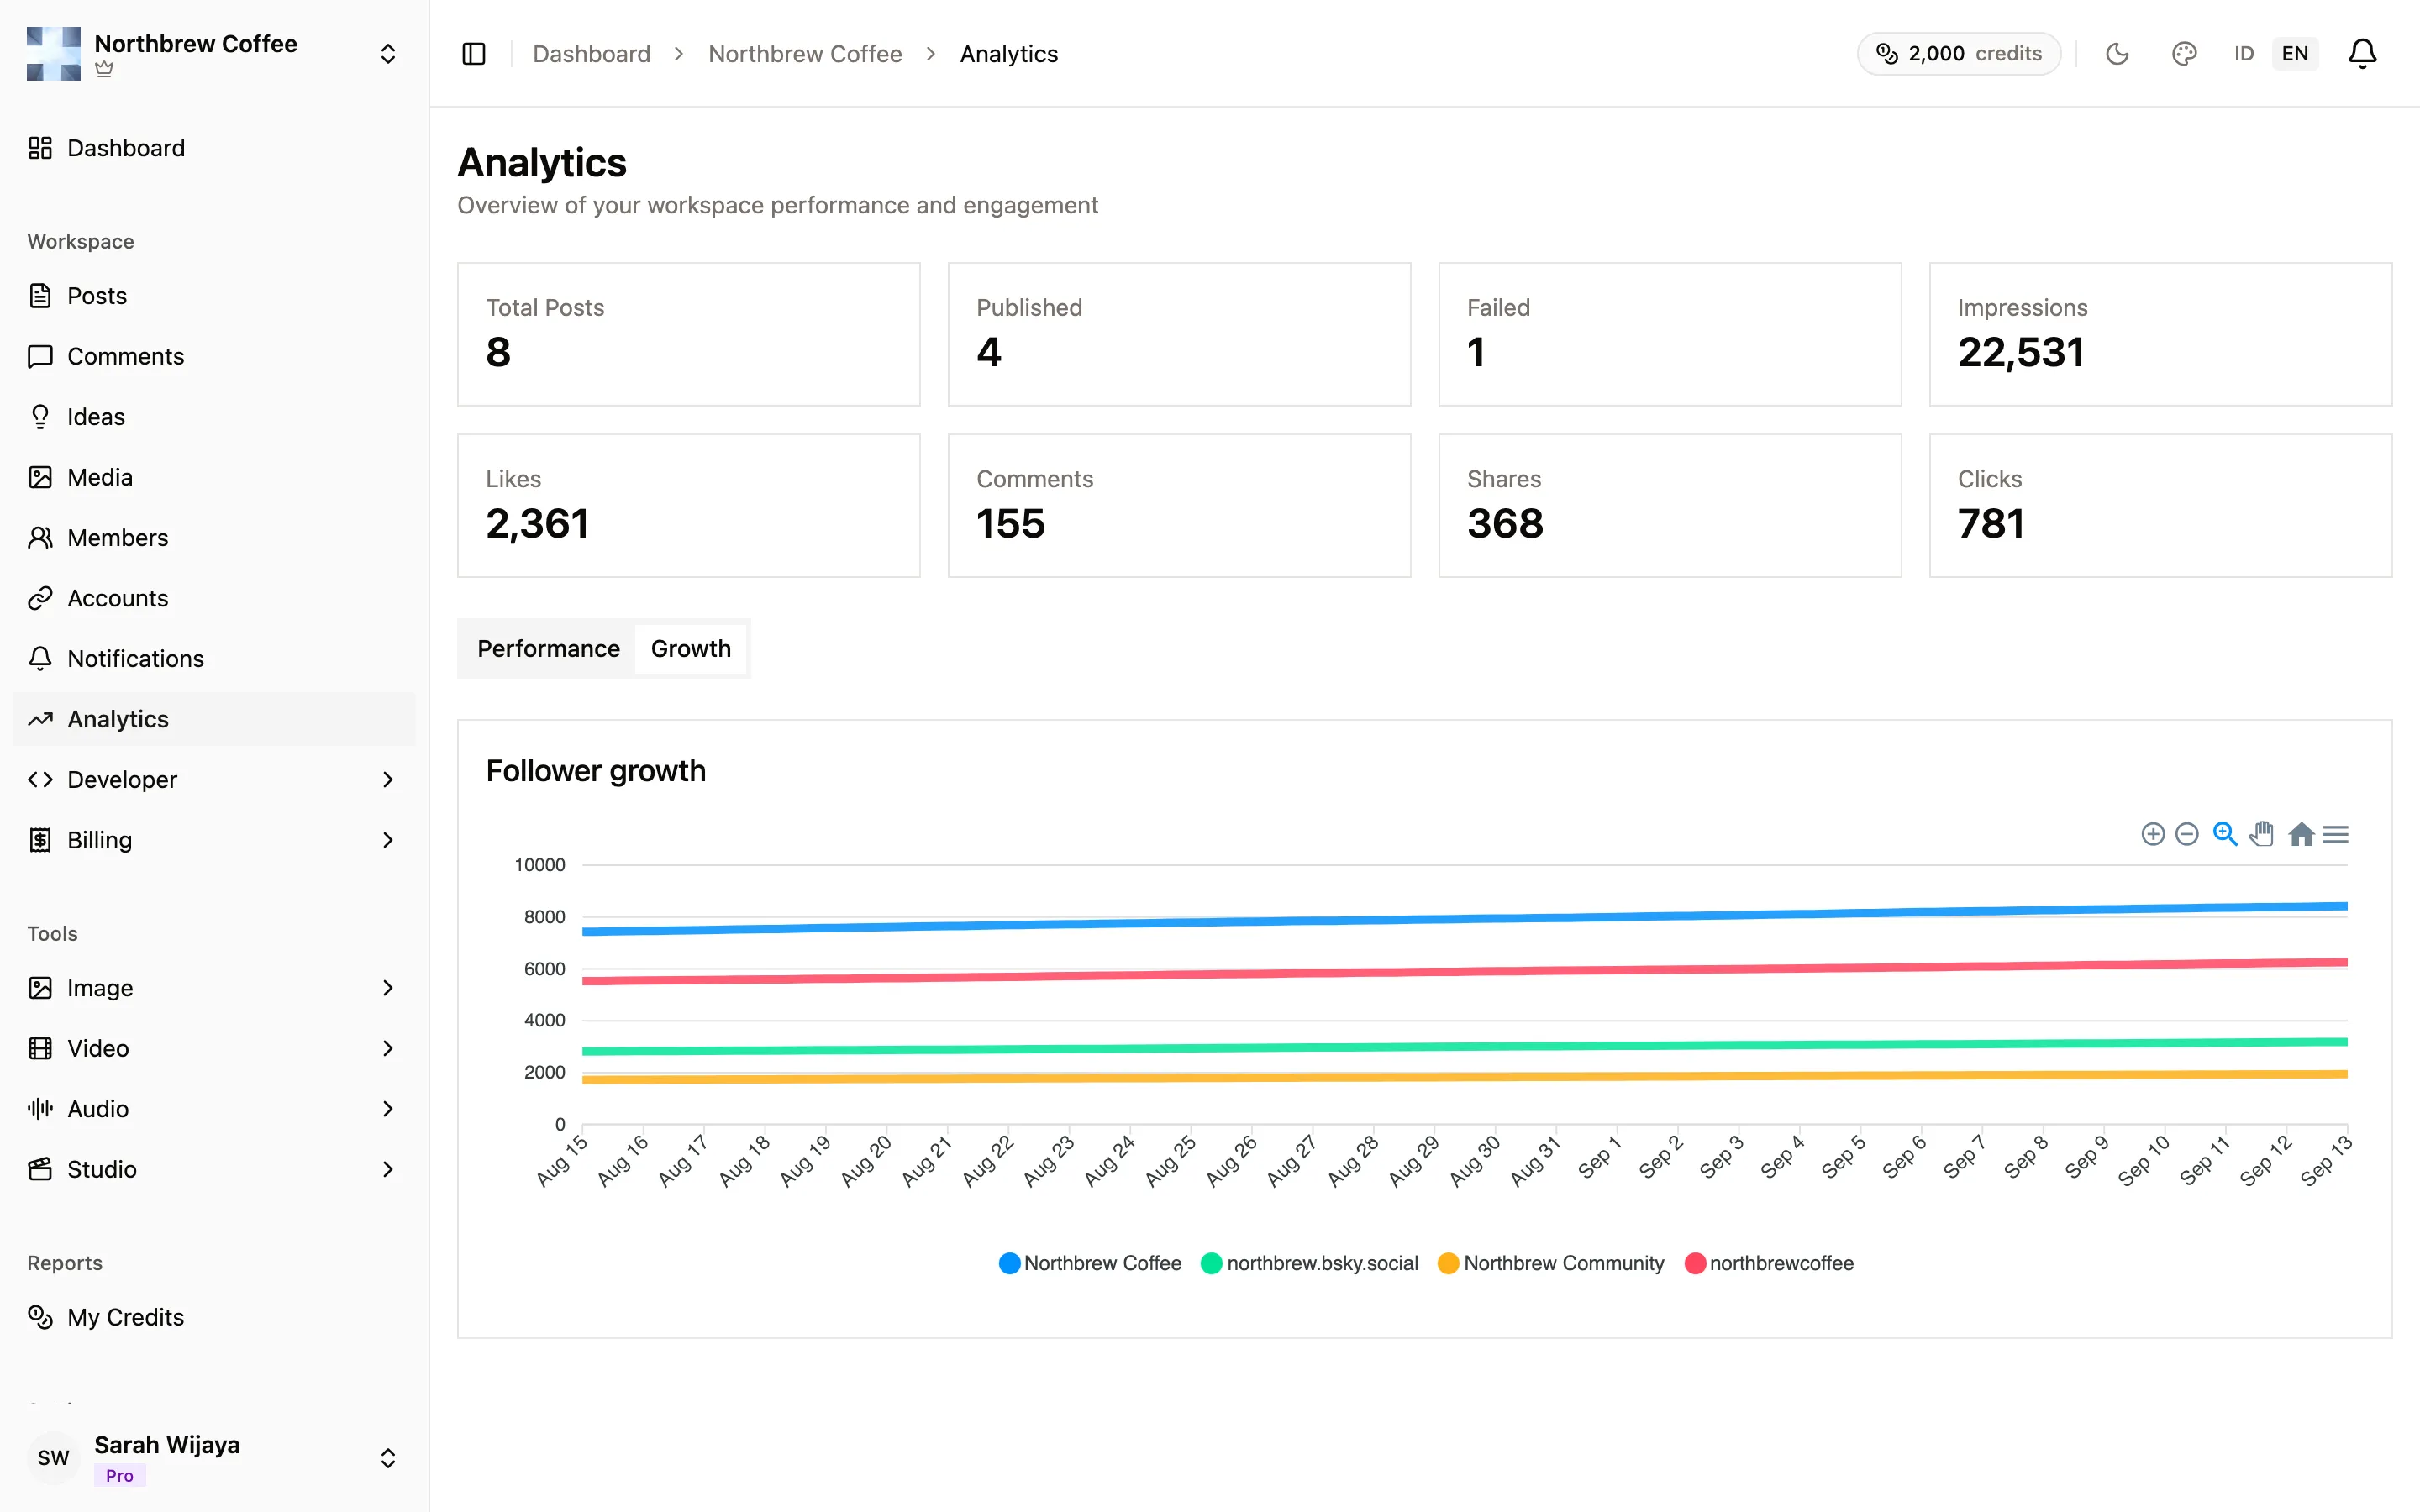
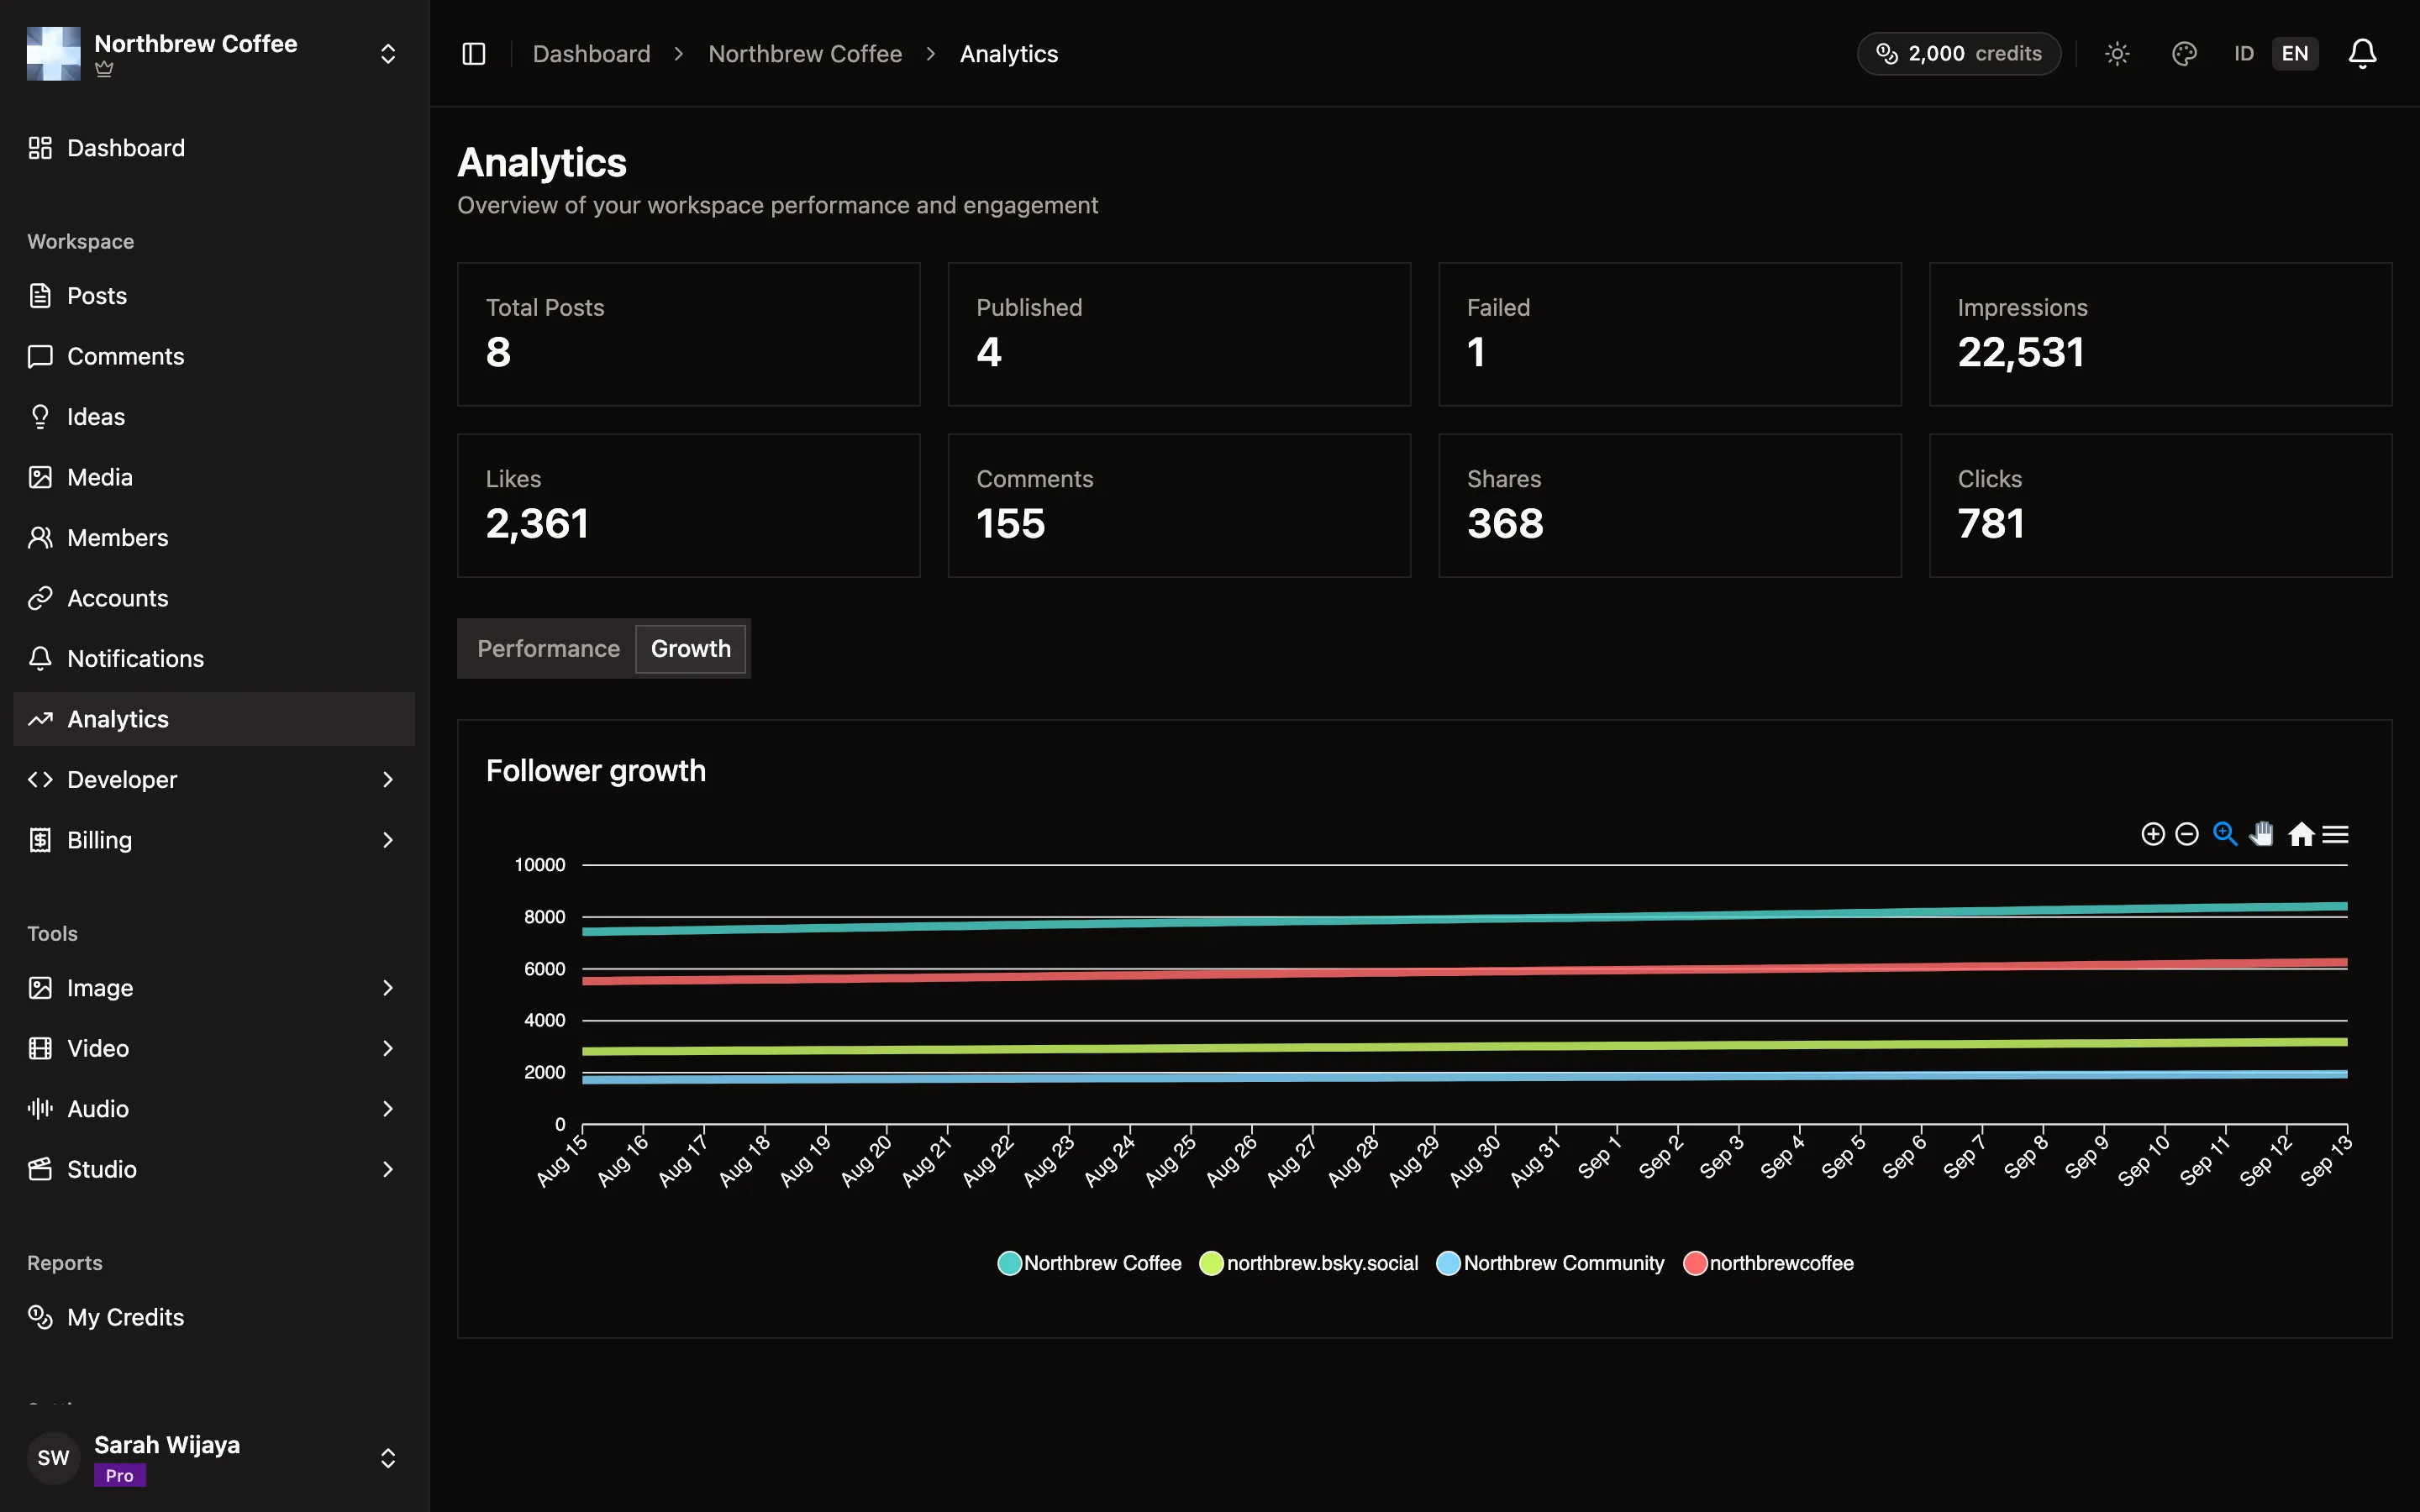
- Growth — one line per connected account, tracking followers over the last 30 days.
What each channel reports
Section titled “What each channel reports”This is the part worth reading before you go looking for a bug. Every platform hands back different numbers, and some hand back none at all.
| Channel | Post engagement | Follower growth |
|---|---|---|
| Bluesky | likes, comments, shares | yes |
| YouTube | not yet | subscribers and views |
| TikTok | not yet | followers and likes |
| Discord | not yet | members, with the bot |
| not yet | not yet | |
| not yet | not yet |
So if your workspace is mostly YouTube, the engagement totals will sit at zero while the growth chart works fine. That’s this table, not a broken sync. Bluesky reports no impressions at all, because the protocol it runs on doesn’t count them.
Discord only reports anything once the optional bot is in the server. See connect Discord.
How fresh the numbers are
Section titled “How fresh the numbers are”- Post engagement is refreshed about once an hour, and again right after a post publishes.
- Follower counts are checked every few hours and stored as one point per day, which is what the growth chart plots. You can force a check with the refresh button on an account row in Connected Accounts.
A disconnected account drops out of the growth chart, and an account with no history yet simply has no line.
On the free plan
Section titled “On the free plan”The free plan shows the Analytics page filled with sample numbers, blurred behind an upgrade prompt. Those aren’t your figures. Your own numbers are still being collected in the background and appear when you move to a paid plan.